


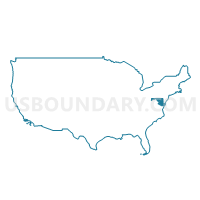
District 13, Baltimore County, Maryland
About
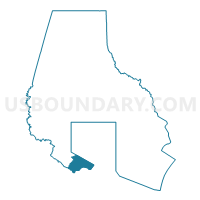
Outline

Summary
| Unique Area Identifier | 133757 |
| Name | District 13 |
| County | Baltimore County |
| State | Maryland |
| Area (square miles) | 10.75 |
| Land Area (square miles) | 10.53 |
| Water Area (square miles) | 0.22 |
| % of Land Area | 97.97 |
| % of Water Area | 2.03 |
| Latitude of the Internal Point | 39.24052950 |
| Longtitude of the Internal Point | -76.67715070 |
| Total Population | 35,911 |
| Total Housing Units | 14,526 |
| Total Households | 13,634 |
| Median Age | 34.2 |
Maps
Graphs
Select a template below for downloading or customizing gragh for District 13, Baltimore County, Maryland


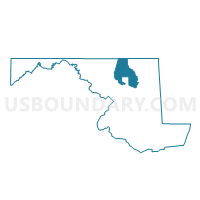
Neighbors
Neighoring County Subdivision (by Name) Neighboring County Subdivision on the Map
- District 1, Baltimore County, MD
- District 1, Anne Arundel County, MD
- District 1, Elkridge, Howard County, MD
- Baltimore city, Baltimore city, MD
Top 10 Neighboring Place (by Population) Neighboring Place on the Map
- Baltimore city, MD (620,961)
- Catonsville CDP, MD (41,567)
- Ilchester CDP, MD (23,476)
- Arbutus CDP, MD (20,483)
- Elkridge CDP, MD (15,593)
- Brooklyn Park CDP, MD (14,373)
- Linthicum CDP, MD (10,324)
- Lansdowne CDP, MD (8,409)
- Baltimore Highlands CDP, MD (7,019)
Top 10 Neighboring Unified School District (by Population) Neighboring Unified School District on the Map
- Baltimore County Public Schools, MD (805,029)
- Baltimore City Public Schools, MD (620,961)
- Anne Arundel County Public Schools, MD (537,656)
- Howard County Public Schools, MD (287,085)
Top 10 Neighboring State Legislative District Lower Chamber (by Population) Neighboring State Legislative District Lower Chamber on the Map
- State Legislative District 32, MD (131,384)
- State Legislative District 10, MD (123,939)
- State Legislative District 31, MD (122,363)
- State Legislative District 46, MD (114,732)
- State Legislative District 44, MD (95,890)
- State Legislative Subdistrict 12A, MD (82,186)
Top 10 Neighboring State Legislative District Upper Chamber (by Population) Neighboring State Legislative District Upper Chamber on the Map
- State Senate District 32, MD (131,384)
- State Senate District 12, MD (124,253)
- State Senate District 10, MD (123,939)
- State Senate District 31, MD (122,363)
- State Senate District 46, MD (114,732)
- State Senate District 44, MD (95,890)
Top 10 Neighboring 111th Congressional District (by Population) Neighboring 111th Congressional District on the Map
- Congressional District 3, MD (719,856)
- Congressional District 2, MD (700,893)
- Congressional District 7, MD (659,776)
Top 10 Neighboring Census Tract (by Population) Neighboring Census Tract on the Map
- Census Tract 6012.01, Howard County, MD (7,544)
- Census Tract 4004, Baltimore County, MD (5,961)
- Census Tract 6011.04, Howard County, MD (5,761)
- Census Tract 4303, Baltimore County, MD (5,557)
- Census Tract 4309, Baltimore County, MD (5,074)
- Census Tract 4307, Baltimore County, MD (5,009)
- Census Tract 2502.05, Baltimore city, MD (4,689)
- Census Tract 4304, Baltimore County, MD (4,407)
- Census Tract 4001, Baltimore County, MD (4,351)
- Census Tract 4301.01, Baltimore County, MD (4,221)
Top 10 Neighboring 5-Digit ZIP Code Tabulation Area (by Population) Neighboring 5-Digit ZIP Code Tabulation Area on the Map
- 21228, MD (47,577)
- 21229, MD (45,213)
- 21230, MD (33,568)
- 21225, MD (33,545)
- 21227, MD (33,534)
- 21075, MD (26,344)
- 21076, MD (12,952)
- 21090, MD (9,784)
Data
Demographic, Population, Households, and Housing Units
** Data sources from census 2010 **
Show Data on Map
Download Full List as CSV
Download Quick Sheet as CSV
| Subject | This Area | Baltimore County | Maryland | National |
|---|---|---|---|---|
| POPULATION | ||||
| Total Population Map | 35,911 | 805,029 | 5,773,552 | 308,745,538 |
| POPULATION, HISPANIC OR LATINO ORIGIN | ||||
| Not Hispanic or Latino Map | 33,655 | 771,294 | 5,302,920 | 258,267,944 |
| Hispanic or Latino Map | 2,256 | 33,735 | 470,632 | 50,477,594 |
| POPULATION, RACE | ||||
| White alone Map | 26,093 | 520,185 | 3,359,284 | 223,553,265 |
| Black or African American alone Map | 5,505 | 209,738 | 1,700,298 | 38,929,319 |
| American Indian and Alaska Native alone Map | 92 | 2,625 | 20,420 | 2,932,248 |
| Asian alone Map | 2,143 | 40,077 | 318,853 | 14,674,252 |
| Native Hawaiian and Other Pacific Islander alone Map | 24 | 319 | 3,157 | 540,013 |
| Some Other Race alone Map | 1,054 | 12,801 | 206,832 | 19,107,368 |
| Two or More Races Map | 1,000 | 19,284 | 164,708 | 9,009,073 |
| POPULATION, SEX | ||||
| Male Map | 17,505 | 380,409 | 2,791,762 | 151,781,326 |
| Female Map | 18,406 | 424,620 | 2,981,790 | 156,964,212 |
| POPULATION, AGE (18 YEARS) | ||||
| 18 years and over Map | 27,486 | 628,279 | 4,420,588 | 234,564,071 |
| Under 18 years | 8,425 | 176,750 | 1,352,964 | 74,181,467 |
| POPULATION, AGE | ||||
| Under 5 years | 2,768 | 48,074 | 364,488 | 20,201,362 |
| 5 to 9 years | 2,174 | 47,454 | 366,868 | 20,348,657 |
| 10 to 14 years | 2,096 | 49,231 | 379,029 | 20,677,194 |
| 15 to 17 years | 1,387 | 31,991 | 242,579 | 12,954,254 |
| 18 and 19 years | 933 | 24,303 | 163,662 | 9,086,089 |
| 20 years | 543 | 12,242 | 81,013 | 4,519,129 |
| 21 years | 548 | 11,847 | 77,465 | 4,354,294 |
| 22 to 24 years | 1,938 | 33,683 | 235,220 | 12,712,576 |
| 25 to 29 years | 3,264 | 53,864 | 393,548 | 21,101,849 |
| 30 to 34 years | 2,726 | 49,691 | 368,494 | 19,962,099 |
| 35 to 39 years | 2,204 | 49,448 | 377,409 | 20,179,642 |
| 40 to 44 years | 2,274 | 53,396 | 418,163 | 20,890,964 |
| 45 to 49 years | 2,680 | 59,590 | 461,585 | 22,708,591 |
| 50 to 54 years | 2,678 | 61,626 | 440,619 | 22,298,125 |
| 55 to 59 years | 2,045 | 54,414 | 377,989 | 19,664,805 |
| 60 and 61 years | 693 | 19,791 | 134,879 | 7,113,727 |
| 62 to 64 years | 920 | 26,908 | 182,900 | 9,704,197 |
| 65 and 66 years | 513 | 13,611 | 97,978 | 5,319,902 |
| 67 to 69 years | 733 | 18,717 | 128,618 | 7,115,361 |
| 70 to 74 years | 885 | 24,142 | 159,761 | 9,278,166 |
| 75 to 79 years | 760 | 20,927 | 124,579 | 7,317,795 |
| 80 to 84 years | 639 | 19,398 | 98,580 | 5,743,327 |
| 85 years and over | 510 | 20,681 | 98,126 | 5,493,433 |
| MEDIAN AGE BY SEX | ||||
| Both sexes Map | 34.20 | 39.10 | 38.00 | 37.20 |
| Male Map | 33.20 | 37.30 | 36.40 | 35.80 |
| Female Map | 35.20 | 40.60 | 39.30 | 38.50 |
| HOUSEHOLDS | ||||
| Total Households Map | 13,634 | 316,715 | 2,156,411 | 116,716,292 |
| HOUSEHOLDS, HOUSEHOLD TYPE | ||||
| Family households: Map | 9,002 | 205,113 | 1,447,002 | 77,538,296 |
| Husband-wife family Map | 5,624 | 144,119 | 1,026,739 | 56,510,377 |
| Other family: Map | 3,378 | 60,994 | 420,263 | 21,027,919 |
| Male householder, no wife present Map | 937 | 15,166 | 104,375 | 5,777,570 |
| Female householder, no husband present Map | 2,441 | 45,828 | 315,888 | 15,250,349 |
| Nonfamily households: Map | 4,632 | 111,602 | 709,409 | 39,177,996 |
| Householder living alone Map | 3,387 | 89,478 | 563,003 | 31,204,909 |
| Householder not living alone Map | 1,245 | 22,124 | 146,406 | 7,973,087 |
| HOUSEHOLDS, HISPANIC OR LATINO ORIGIN OF HOUSEHOLDER | ||||
| Not Hispanic or Latino householder: Map | 13,085 | 307,772 | 2,042,193 | 103,254,926 |
| Hispanic or Latino householder: Map | 549 | 8,943 | 114,218 | 13,461,366 |
| HOUSEHOLDS, RACE OF HOUSEHOLDER | ||||
| Householder who is White alone | 10,475 | 217,096 | 1,341,508 | 89,754,352 |
| Householder who is Black or African American alone | 1,980 | 78,443 | 622,144 | 14,129,983 |
| Householder who is American Indian and Alaska Native alone | 26 | 882 | 6,756 | 939,707 |
| Householder who is Asian alone | 683 | 12,457 | 99,940 | 4,632,164 |
| Householder who is Native Hawaiian and Other Pacific Islander alone | 8 | 104 | 993 | 143,932 |
| Householder who is Some Other Race alone | 239 | 3,144 | 46,824 | 4,916,427 |
| Householder who is Two or More Races | 223 | 4,589 | 38,246 | 2,199,727 |
| HOUSEHOLDS, HOUSEHOLD TYPE BY HOUSEHOLD SIZE | ||||
| Family households: Map | 9,002 | 205,113 | 1,447,002 | 77,538,296 |
| 2-person household Map | 3,381 | 85,891 | 565,688 | 31,882,616 |
| 3-person household Map | 2,371 | 50,849 | 349,624 | 17,765,829 |
| 4-person household Map | 1,802 | 40,190 | 295,126 | 15,214,075 |
| 5-person household Map | 824 | 17,527 | 138,670 | 7,411,997 |
| 6-person household Map | 376 | 6,620 | 56,194 | 3,026,278 |
| 7-or-more-person household Map | 248 | 4,036 | 41,700 | 2,237,501 |
| Nonfamily households: Map | 4,632 | 111,602 | 709,409 | 39,177,996 |
| 1-person household Map | 3,387 | 89,478 | 563,003 | 31,204,909 |
| 2-person household Map | 952 | 17,855 | 113,850 | 6,360,012 |
| 3-person household Map | 165 | 2,882 | 19,295 | 992,156 |
| 4-person household Map | 87 | 1,002 | 8,215 | 411,171 |
| 5-person household Map | 29 | 241 | 2,989 | 126,634 |
| 6-person household Map | 7 | 83 | 1,125 | 48,421 |
| 7-or-more-person household Map | 5 | 61 | 932 | 34,693 |
| HOUSING UNITS | ||||
| Total Housing Units Map | 14,526 | 335,622 | 2,378,814 | 131,704,730 |
| HOUSING UNITS, OCCUPANCY STATUS | ||||
| Occupied Map | 13,634 | 316,715 | 2,156,411 | 116,716,292 |
| Vacant Map | 892 | 18,907 | 222,403 | 14,988,438 |
| HOUSING UNITS, OCCUPIED, TENURE | ||||
| Owned with a mortgage or a loan Map | 6,408 | 157,590 | 1,146,636 | 52,979,430 |
| Owned free and clear Map | 2,114 | 53,981 | 309,139 | 23,006,644 |
| Renter occupied Map | 5,112 | 105,144 | 700,636 | 40,730,218 |
| HOUSING UNITS, VACANT, VACANCY STATUS | ||||
| For rent Map | 470 | 8,112 | 61,874 | 4,137,567 |
| Rented, not occupied Map | 37 | 354 | 3,742 | 206,825 |
| For sale only Map | 157 | 3,897 | 32,883 | 1,896,796 |
| Sold, not occupied Map | 20 | 765 | 6,586 | 421,032 |
| For seasonal, recreational, or occasional use Map | 17 | 1,405 | 55,786 | 4,649,298 |
| For migrant workers Map | 1 | 7 | 177 | 24,161 |
| Other vacant Map | 190 | 4,367 | 61,355 | 3,652,759 |
| HOUSING UNITS, OCCUPIED, AVERAGE HOUSEHOLD SIZE BY TENURE | ||||
| Total: Map | 2.62 | 2.48 | 2.61 | 2.58 |
| Owner occupied Map | 2.62 | 2.59 | 2.71 | 2.65 |
| Renter occupied Map | 2.62 | 2.24 | 2.42 | 2.44 |
| HOUSING UNITS, OCCUPIED, TENURE BY RACE OF HOUSEHOLDER | ||||
| Owner occupied: Map | 8,522 | 211,571 | 1,455,775 | 75,986,074 |
| Householder who is White alone Map | 7,780 | 162,966 | 1,020,305 | 63,446,275 |
| Householder who is Black or African American alone Map | 336 | 37,302 | 323,160 | 6,261,464 |
| Householder who is American Indian and Alaska Native alone Map | 16 | 445 | 3,783 | 509,588 |
| Householder who is Asian alone Map | 217 | 7,254 | 66,324 | 2,688,861 |
| Householder who is Native Hawaiian and Other Pacific Islander alone Map | 6 | 53 | 458 | 61,911 |
| Householder who is Some Other Race alone Map | 71 | 1,256 | 20,907 | 1,975,817 |
| Householder who is Two or More Races Map | 96 | 2,295 | 20,838 | 1,042,158 |
| Renter occupied: Map | 5,112 | 105,144 | 700,636 | 40,730,218 |
| Householder who is White alone Map | 2,695 | 54,130 | 321,203 | 26,308,077 |
| Householder who is Black or African American alone Map | 1,644 | 41,141 | 298,984 | 7,868,519 |
| Householder who is American Indian and Alaska Native alone Map | 10 | 437 | 2,973 | 430,119 |
| Householder who is Asian alone Map | 466 | 5,203 | 33,616 | 1,943,303 |
| Householder who is Native Hawaiian and Other Pacific Islander alone Map | 2 | 51 | 535 | 82,021 |
| Householder who is Some Other Race alone Map | 168 | 1,888 | 25,917 | 2,940,610 |
| Householder who is Two or More Races Map | 127 | 2,294 | 17,408 | 1,157,569 |
| HOUSING UNITS, OCCUPIED, TENURE BY HISPANIC OR LATINO ORIGIN OF HOUSEHOLDER | ||||
| Owner occupied: Map | 8,522 | 211,571 | 1,455,775 | 75,986,074 |
| Not Hispanic or Latino householder Map | 8,322 | 207,412 | 1,397,724 | 69,617,625 |
| Hispanic or Latino householder Map | 200 | 4,159 | 58,051 | 6,368,449 |
| Renter occupied: Map | 5,112 | 105,144 | 700,636 | 40,730,218 |
| Not Hispanic or Latino householder Map | 4,763 | 100,360 | 644,469 | 33,637,301 |
| Hispanic or Latino householder Map | 349 | 4,784 | 56,167 | 7,092,917 |
| HOUSING UNITS, OCCUPIED, TENURE BY HOUSEHOLD SIZE | ||||
| Owner occupied: Map | 8,522 | 211,571 | 1,455,775 | 75,986,074 |
| 1-person household Map | 1,962 | 48,355 | 307,832 | 16,453,569 |
| 2-person household Map | 2,929 | 74,420 | 495,651 | 27,618,605 |
| 3-person household Map | 1,548 | 37,491 | 259,318 | 12,517,563 |
| 4-person household Map | 1,198 | 30,662 | 224,773 | 10,998,793 |
| 5-person household Map | 510 | 13,008 | 100,730 | 5,057,765 |
| 6-person household Map | 222 | 4,774 | 39,299 | 1,965,796 |
| 7-or-more-person household Map | 153 | 2,861 | 28,172 | 1,373,983 |
| Renter occupied: Map | 5,112 | 105,144 | 700,636 | 40,730,218 |
| 1-person household Map | 1,425 | 41,123 | 255,171 | 14,751,340 |
| 2-person household Map | 1,404 | 29,326 | 183,887 | 10,624,023 |
| 3-person household Map | 988 | 16,240 | 109,601 | 6,240,422 |
| 4-person household Map | 691 | 10,530 | 78,568 | 4,626,453 |
| 5-person household Map | 343 | 4,760 | 40,929 | 2,480,866 |
| 6-person household Map | 161 | 1,929 | 18,020 | 1,108,903 |
| 7-or-more-person household Map | 100 | 1,236 | 14,460 | 898,211 |
Loading...